All you need to know
In this essay I review all the 11 arguments relevant to the hypothesis of Dangerous Man-made (Anthropogenic) Climate Change because of Global Warming caused by greenhouse gasses, and provide all the facts you need to know. (Download PDF)
The arguments:
1. 97% of scientists agree that the climate is changing dangerously because of human activities.
2. Dangerous Man-made Global Warming caused by greenhouse gasses is just a matter of basic physics, like the theory of gravity.
3. There is evidence of an ongoing amplified/accelerating greenhouse effect.
4. It is impossible to explain most of the warming since 1950 with natural causes, and thus we must conclude that it is mainly Man-made.
5. There are ample signs of Man-made Global Warming – melting ice, rising sea levels, more extreme weather, warming oceans, ocean acidification and coral bleaching.
6. The U.N. IPCC is a scientifically credible organisation.
7. Computer models reliably predict future climate.
8. No-one profits from promoting anthropogenic global warming.
9. Mitigation of climate change is all positive regardless of whether it is Man-made or not.
10. Better to be be safe than sorry – taking climate change seriously is like an insurance in case it really is Man-made.
11. It’s a good thing that we end our addiction to fossil fuels anyway.
Scientific issues
Argument #1
97% of scientists agree that the climate is changing dangerously, mainly because of human activities.
This argument from authority is probably the most convincing of all to non-scientists, and probably also to scientists who are not specialised in climatology. It’s not really a scientific argument, of course – science is not done by majority decisions, but it’s still scientific in form, i.e. it makes an empirical claim that is testable.
In most cases it’s really quite smart for non-experts to trust experts, because everyone cannot know and fact-check everything. We all know that experts can be wrong, even a large majority of experts, but most of us aren’t a Galileo or Einstein with the brains to challenge a scientific consensus.
The problem is that this way of thinking also makes us susceptible to manipulation (if that ever happens), and in some cases, when there’s a lot at stake, it might be a good idea to try to think for ourselves and listen to what the “crazy fringe” sceptics have to say. To start with, we should at least try to verify if there really is anything like a consensus on the issue at hand.
In this case the consensus is actually a myth and not a verified fact. It is based on heavily flawed studies that NASA should be ashamed to promote, and reporters should be ashamed not to scrutinize more thoroughly. None of them is done by climate scientists, not even STEM-scientists.
If these studies show anything, it is merely that almost all climate scientists (97%, 98%, 99% or in one case 100%) agree on the evident facts that:
1. the global mean temperature has increased since 1880 (but how much?).
2. the amount of atmospheric greenhouse gasses has increased, to a large part because of emissions of carbon dioxide from the burning of fossil fuels.
3. an increase of atmospheric greenhouse gasses is likely to have some effect on global temperatures (but how much?).
This is not nearly enough to verify the claim in Argument #1. Even most sceptics of dangerous anthropogenic global warming agree to these points. But they don’t agree that the increase in atmospheric greenhouse gasses is the main, or even an important, driver behind climate change. They generally consider the mild warming since 1880 as part of a natural climate cycle that is not likely to be dangerous.
But many of these sceptics are included in the 97%, just because they agree that greenhouse gasses may have had at least some effect on global temperatures. Scientists like Craig Idso, Nicola Scafetta, Willie Soon, Nir Shaviv and Nils-Axel Mörner are all famous for their skepticism of anthropogenic global warming, but are included in the 97% consensus. They have all explicitly stated that their research papers have been misinterpreted. In the study by Cook et al (2013, see below), a survey of the Abstracts of scientific papers, they are included in the category labelled “explicitly endorses but does not quantify or minimize” (i.e. they don’t say anything about how large the human influence is).
Furthermore, many of the papers included in the 97% are not concerned with the causes of climate change, but merely accepts the consensus as a starting point, e.g. in the study of probable consequences of global warming for the economy or for certain animal species etc. Cook et al calls it “implicit endorsement”, and include them in the 97% consensus despite the fact that the authors of the papers have no expertise in the science involved in Argument #1.
Finally, although Cook et al claims to have studied 11 944 scientific articles, in the final result they disregard the 66,73% of the articles that stated “no position”.
So, according to the numbers in the study, instead of 97% it is really only 0,54% of the papers studied that actually explicitly accepts Argument #1:

A charitable interpretation would be to just discard of the 66,73% of the papers with no position, whereby the number would be 1,6% instead, i.e. 64 out of 3974.
The point, of course, is not to claim that ether of these numbers is closer to the truth, but to reveal the manipulative nature of these studies. The fact that NASA promotes this biased nonsense, and no journalists expose it to the world, is a bad sign of either sloppiness or serious bias or both.
So, Argument #1 clearly seems dishonest and designed to stop people from even listening to the “crazy fringe” sceptics. That should make anyone very suspicious and eager to do just that.
In reality, it would not be very surprising if the majority of scientists at some point is shown to agree with Argument #1, because that seems to be the required credo for receiving research funding nowadays. So far, however, the sceptics are far more numerous and qualified than the myth implies.
But what about all the scientists on the UN Intergovernmental Panel on Climate Change (IPCC) that summarize the best and most recent research? Why would they all support the position of the so-called consensus if they didn’t believe it to be true?
I will return to these obvious questions, but what really matters is the scientific evidence. So first, let’s have a look at the proper scientific arguments on climate change.
Argument #2
Dangerous Man-made Global Warming caused by greenhouse gasses is just a matter of basic physics, like the theory of gravity.

This graph represents the mainstream view presented to us by the UN IPCC, NOAA (the US National Oceanic and Atmospheric Administration) and NASA-GISS (Goddard Institute for Space Studies, a department of NASA – which, by the way, had nothing to do with the Apollo program).
But it is not just basic physics. True enough, the warming effect of greenhouse gasses as such is close to being accepted as basic physics. Nevertheless, Argument #2 is false, because the basic physics of greenhouse gasses does not warrant the simple lock-step correlation between atmospheric carbon dioxide and global warming implied by the graph above. “Dangerous anthropogenic global warming” is a hypothesis requiring controversial assumptions about still unresolved scientific issues in addition to the basic greenhouse effect.
According to basic physics, the greenhouse effect is not linear, even less exponential, and the warming in the graph above is not what we should expect from greenhouse gasses alone. According to basic physics the warming effect of greenhouse gasses increases logarithmically, i.e. the effect from every increase is diminishing, rather like the opposite of “exponential”. Under controlled laboratory conditions a doubling of the amount of carbon dioxide causes the temperature to rise with 1,1°C. Like this:

A temperature increase with 1,1°C from preindustrial levels requires an increase of carbon dioxide from 280 ppm to 560 ppm, from todays approximately 400 ppm to 800 ppm, and from there and increase to 1600 ppm. More and more carbon dioxide is needed to cause the same warming effect. The same goes for other greenhouse gasses, like methane.
Todays levels are only about half the increase required to cause the more than 1,1°C warming shown in the first graph above. Of course, there are also natural climate drivers, like variations in the amount of energy the Earth receives from the sun, as well as other anthropogenic factors, but the effects from these are controversial and far from just a matter of basic physics. According to NOAA, NASA and the IPCC other natural climate drivers are not enough to explain the modern warming. The anthropogenic global warming hyothesis requires assumptions about amplification from positive feedbacks in the climate system, i.e. secondary effects that further increases the warming from the greenhouse gasses alone.
The direct warming effect from an increase in atmospheric greenhouse gasses will, for instance, in turn cause more evaporation from the oceans, because warmer air can hold more vapor. And water vapor is the most important greenhouse gas, much more effective and dominant than carbon dioxide or all the other greenhouse gasses together. More water vapor leads to more warming that leads to even more water vapor in an accelerating vicious circle.
The hypothesis of anthropogenic global warming requires a threefold amplification, mainly by water vapor, of the direct effect of greenhouse gasses, in order to explain the warming since 1880.
This is, on average, what the IPCC climate models and predictions of future climate are based on:

The worst-case scenarios for the future are based on assumptions of even stronger amplification from positive feedbacks, with up to 6 times the direct effect from carbon dioxide alone. Those scenarios are the one’s normally picked up by media and other groups wishing to profit in one way or another from the perception of an imminent climate catastrophe.
But these amplification claims are highly controversial and far from basic science, because the climate system is complicated and still poorly understood. There’s a multitude of feedbacks, many of which are actually negative, i.e. have a cooling effect, and there’s no consensus on the final balance. More water vapor means more clouds, for instance, that increase the Earth’s albedo by reflecting sunlight back to space. Some reputable climatologists believe that the negative feedbacks dominate to the extent that the final result of both positive and negative feedbacks is a dampening of the warming to just 50% of the direct effect from greenhouse gasses alone:

There is no agreement at all among climate scientists about how “sensitive” the climate system is to an increase of greenhouse gasses, i.e. what the final effect of positive and negative feedbacks is on balance, and the uncertainties are notorious and large:
Argument #3
There is overwhelming evidence of an ongoing amplified/accelerating greenhouse effect.
Actually no. Not at all.
There are some obvious tests that could prove the hypothesis of an amplified greenhouse effect. The hypothesis of dangerous anthropogenic global warming caused by an amplified greenhouse effect implies that…
1. … the specific humidity in the atmosphere has increased. Has it? Well, a little bit at the surface yes, but not accelerating. Not very convincing at 4,2 km either – actually a slight decline over time, but with changes more consistent with a climate cycle than dangerous global warming. 9 km is at the top of the troposphere, and a decline there might be consistent with more energy being trapped below, but it really goes up and down, with little difference in the end:

2. …the warm and humid air has formed a “hot-spot” in the mid-troposphere in the Tropics (this phenomenon has been called “the fingerprint of global warming”). Has it? No:
3. …if more and more heat is “trapped” in the atmosphere there should have been a decrease in the infrared radiation from the atmosphere to space over time. Has it? No, infrared radiation from Earth to space has increased, according to ERBE (Earth Radiation Budget Experiment, by atmospheric physicist Richard Lindzen and Yong-San Choi, Massachusetts Institute of Tehcnology, MIT):

11 climate models predict a decrease in outgoing longwave radiation from Earth to space, but, on the contrary, as the Earth has warmed, the infrared radiation to space seems to have increased, which suggests either that negative feedbacks totally dominate, even negate, the positive ones. But that seems odd – warming that through negative feedback cause cooling?
Another plausible interpretation is that the warming is not caused very much at all by the greenhouse effect, but rather that the Earth has received more energy from the sun, either by increased solar activity or by less cloud cover, or both. These two factors may even be causally linked, as I will explain later on.
Of course, these results have been questioned, and others have got other results. This is not surprising, even a widely respected researcher like Dr. Richard Lindzen gets criticisms, like everyone else. And of course they have replied (Lindzen & Choi 2011).
If nothing else, it proves that the scientific debate on the causes of climate change is far from over.
However, here are NASA’s own measurements of the OLR (Outgoing Longwave Radiation) fråm 1979:

On a just a little larger scale, however, the whole question seems somewhat more complicated, but definitely not alarming (data from NOAA):

Argument #4
It is impossible to explain most of the warming since 1950 with natural causes, and thus we must conclude that it is mainly Man-made.
This is a more complicated argument to refute, but it is certainly doubtful that it is correct, not merely because of the obvious logical fallacy of excluding the possibility of natural causes we yet don’t know about. It is also not likely that the global temperature has increased as much as the argument requires.
No-one is contesting the fact that the global mean temperature has increased since 1850, after a 500 years long period of cooling called The Little Ice Age, that, in turn followed on the so called Medieval Warm Period, at least as warm as today:

There is a clear correlation between the solar activity and temperature, as shown here for the last 400 years, with a couple of periods of low solar activity corresponding to the cold-spells called the “Maunder minimum” and the “Dalton Minimum” at the end of the Little Ice Age:

And the warming from 1800 throughout the 20th century correlates to a long period of increasing solar activity.
There is a very good correlation between temperature and solar activity from 1860 all the way into the 1980’s…

… when the solar activity started to decline while temperatures continued to rise, according to NASA-GISS:

According to the official story it is not possible to explain the majority of the sharp warming after 1950 without reference to the influence of increasing atmospheric carbon dioxide, of which a large part is proven to have its origin in human activities.
But this is not the only official or otherwise credible story, and there are actually good reasons to question how much the globe has actually warmed.
Today, institutions like the American NOAA and NASA-GISS presents a graph that indicates a temperature increase of about 1,7°C since 1880, most of it after 1970, when the warming also accelerates:

… while the British Hadley Climate Research Unit at University of East Anglia as late as 2009 claimed a rise of only about 0,6°C since 1880, when NASA-GISS already had about 1,5°C. Also, there’s no accelerating trend (HadCRUT3):

Measurements by satellites indicate that there has been virtually no warming since 2002, so it’s safe to assume that about the same is still true (RSS, Remote Sensing System – disregard the natural warming spikes from El Nino):
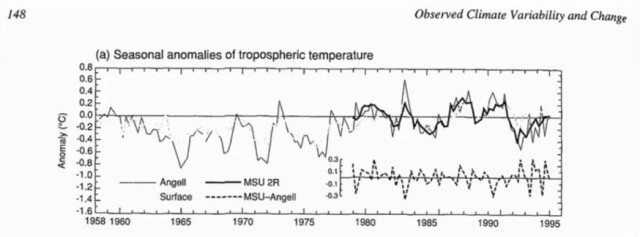
 In 1995 the IPCC presented graphs showing virtually no rise at all between 1958 and 1995:
NASA-GISS has revised their own data quite dramatically several times since 1980, whereby the temperature curve has become steeper and steeper:

Such “administrative adjustments” are regularly applied to the data provided by the ground-based weather stations around the world that is the source for these temperature curves. Missing data is filled in (many stations are run by amateurs), data is altered when equipment has been changed or moved or when a station reports otherwise questionable data. There is nothing intrinsically wrong about that, but there is lots of room for arbitrary or even biased judgements, which is part of why these graphs are less reliable than graphs based on data from satellites or weather balloons. Some adjustments, like the “time of observation bias” has been shown to be flat out wrong, and the so called Heat Island Effect (from urbanization) has been taken by NOAA to be generally reversed by other changes to the stations. However, the very large adjustments made by NASA-GISS to their own old data is certainly questionable and seem to be far from justifiable.
For instance, they have erased a cooling period between 1940 and 1975 that was obvious not only in their own graph from 1981 (above), but was widely recognized at the time, and the reason why there was a common fear among climatologists that the world was about to enter a new Little Ice Age:

In 2018 NASA-GISS has turned this period (shaded blue) of cooling into a practically flat temperature trend:  But independent climatic data, for instance regarding Arctic Sea Ice Extent, are consistent with considerable cooling between 1940 and 1975:
 As are the data for the Mass Balance of the Greenland ice sheet:
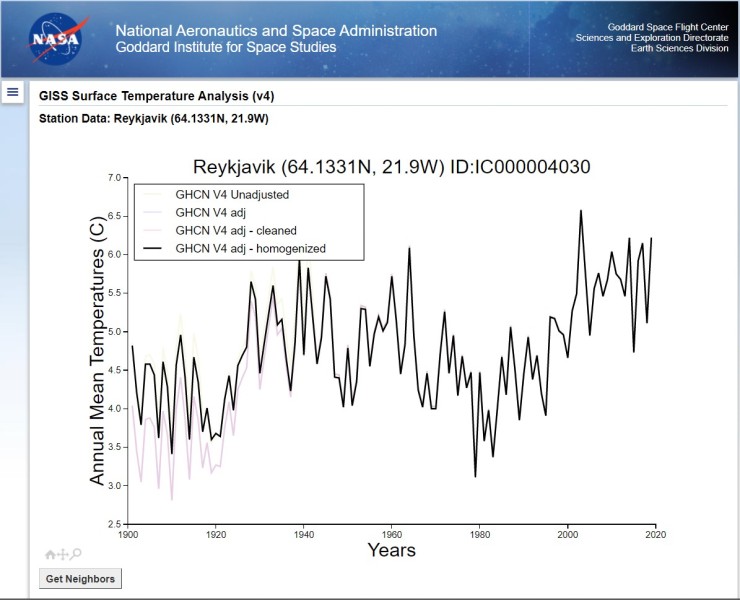
 And the (NASA-GISS 2012) temperature data from Reykjavik, Island:
 This graph also shows that the variations in temperature are correlated with, not atmospheric carbon dioxide, but with the regularly occurring warm and cold phases of the ocean currents in the Atlantic.
One year later, in 2013, NASA-GISS has “adjusted” the Reykjavik temperature data:
 However, NASA apparently got cold feet when the Reykjavik adjustment was questioned by an Australian senator, and changed the curve back again to the previous version, which is again what you find in the NASA surface temperature database:
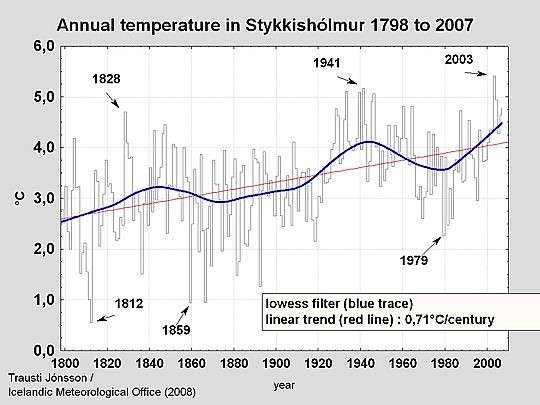
This is consistent with other official data from Iceland, for instance Stykkisholmur:
A similar pattern is found in unadjusted temperature records all over the world: most or all of the warming during the last 150 years actually happened before 1940, followed by 40 years of cooling before it turned warmer again right att the start of the global warming scare in the 1980’s. But the warming in the first half of the 20th centure has been adjusted down in order to exaggerate the warming trend in the same way as NASA-GISS tried to do in Reykjavik
So, there is good reason to be doubtful regarding the adjusted NASA-GISS data. Especially since the number of adjustments has increased dramatically in the last 20 years (left graph below), and the adjustments all make the curve steeper by lowering temperatures before 2000 and rising them after (right graph:

In fact, all the warming that NOAA, NASA and the IPCC claims cannot be explained naturally and therefore must be caused by human emissions of greenhouse gasses, is created by these “administrative adjustments”. Which means, ironically, that global warming actually is Man-made.
The British data has, at least until 2009, been subjected to less such adjustments, and fit perfectly with natural causes such as solar and ocean cycles:
The decline in solar activity since the 1990’s is also reflected in flat temperature trend in the data from satellites and weather balloons since 2002, in stark contrast to what the official Climate Models have predicted:
(Note that the warming peak in 2015 in the satellite and balloon data is the effect of the weather phenomenon El Nino, not of anthropogenic global warming.)
Finally, the problem that the variations in solar output are too small to account for large temperature variations on Earth may very well have a solution.
First, the temperature increase may not have been as large as officially claimed. Satellites indicate they have been essentially flat since 2002 (apart from natural El Nino events):

Satellite data are the most reliable we have, because they cover the whole globe circling the poles, and are not adjusted at all. Corrected, yes, due to very well known and precise orbital deviations, but there’s no need for complicated “administrative adjustments” involving, for instance, infilling of missing data or other uncertainties.
Secondly, the NASA data on Total Solar Irradiance are also suspiciously adjusted, and may not have decreased as much at the end of the 20th century as presumed:
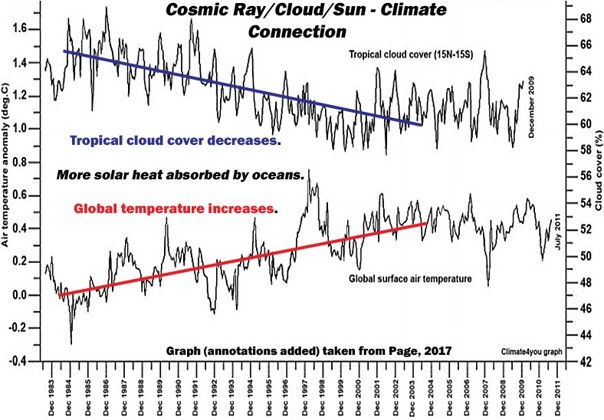
 Thirdly, and most importantly, physicists Henrik Svensmark and Nir Shaviv have suggested that the effect from the sun is not only direct, but also indirect, in that the solar wind regulates the number of cosmic rays reaching Earth and contributing to cloud formation. A strong solar wind blocks the influx of cosmic rays, and a weak solar wind let’s more through. In the atmosphere the cosmic rays form small particles that water vapor can condense on, and consequently the correlation between cosmic rays and reflective cloud cover is strong:
 As is the correlation between cloud cover and global temperature:
The warming during the past 150 years may not mainly be a result of human emissions of greenhouse gasses, perhaps not a greenhouse effect at all.
Unsurprisingly, this hypothesis has not been very popular among the mainstream, state-funded scientists that depend for their livelihood and academic career on man-made global warming. Regardless, it shows that there may be plausible natural explanations to climate change outside the established box. The problem today is, I think, that not many are looking for them, because the money is in man-made global warming.
Argument #5
There are ample signs of anthropogenic global warming – melting ice, rising sea levels, more extreme weather, warming oceans, ocean acidification and coral bleeching.
Melting ice and sea level rise are certainly signs of climate change, but not necessarily of anthropogenic global warming. Extreme weather, on the other hand, is neither actually increasing nor an expected effect of global warming, anthropogenic or not. It is not at all clear either that the oceans are acidifying (they are definitely not acidic, but alkaline, and will remain so) or that the effects of more carbon dioxide in the oceans is detrimental to marine life, and coral bleeching is a recurring temporary phenomenon following Pacific Ocean cycles.
Melting ice
Arctic sea ice extent has abated about 2 million square kilometers since 1979. That may sounds scary, and is certainly a consequence of a warmer climate. But it is, in itself, not a proof that it is caused by human activities. Nor is it necessarily a sign of imminent catastrophe.
 It is, in fact, a totally normal and natural process, that becomes evident as soon as we get a historical perspective on what happened inte Arctic before 1979, as shown in the first report from the U.N. Intergovernmental panel on Climate Change (1990):

It turns out that 1979 was a year with unusually much sea ice in the Arctic, almost 2 million square kilometers more than 1973, which makes it a very dubious starting point that gives a deceptive impression of the melting the last 40 years being unique and dramatic. It rather seems that the sea ice melts and freezes as part of a natural cycle.
Going back further in time it becomes obvious that it is normal and natural for the Arctic Sea Ice to melt and grow periodically. According to the US Department of Energy (1985) it melted as much between 1930 and 1960 as after 1979 until today. And the climate cycle is confirmed by NASA-GISS temperature data for Greenland:
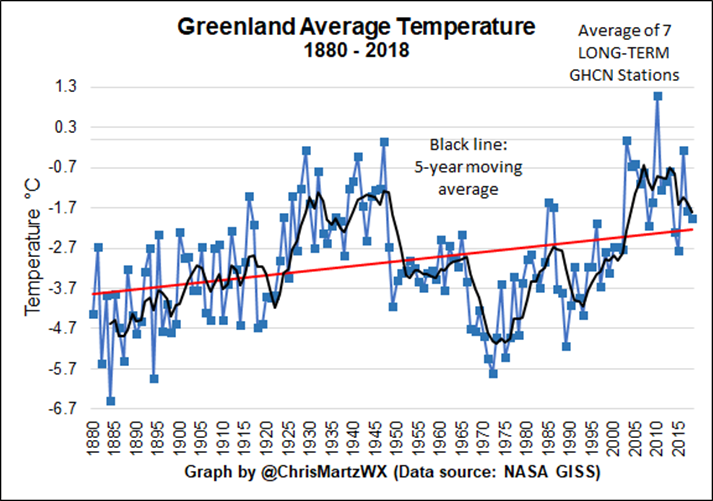
Naturally, the same climate cycle is also clearly manifested in the records of the mass balance of the Greenland glaciers:
As one would expect, there are signs that the climate cycle is about to reverse again, as indicated by cooling temperatures in Greenland since 2005 (with the odd exception of 2012. Apart from that the mass balance of the Greenland ice sheets has been normal, with unusually little ice loss during summer the last couple of years. And the Arctic sea ice extent has been stable since 2007 (according to the Sea Ice Index, SII, 2008 according to MASIE):

One might argue that the extent of sea ice is less interesting, since the measure is affected by winds and storms, but the Arctic Sea Ice Volume tells the same story: The dotted lines represent the predictions made by the climate authorities NOAA, NASA and the IPCC – as well as the Nobel Peace prize winner Al Gore and former US Secretary of State John Kerry. It is neither their first nor only failed prediction of climate disaster. Why should we continue to take them seriously.
Sea level rise
It is a fact that sea levels have been rising in the last couple of hundred years because the world has become warmer. The cause is partly that glaciers have been melting, and partly that the oceans have warmed and expanded. It should be noted, however, that thermal expansion does not affect the shoreline, simply because there is so little water there to expand. The effect of thermal expansion on the sea level decreases as the hight of the water column grows smaller closer to land and is zero at the shore:

Finally, sea levels are affected by geological processes, e.g. when land rises or sinks.
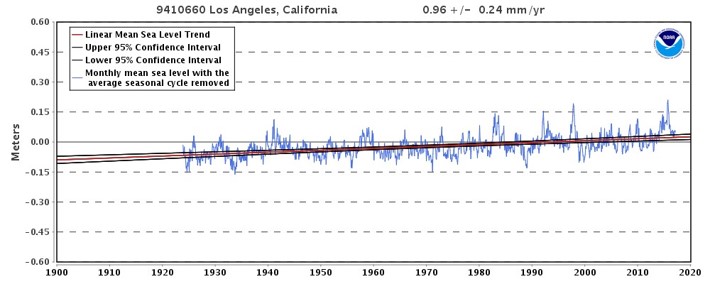
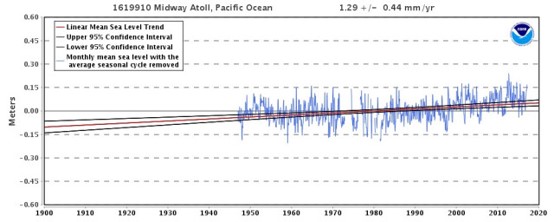
To the extent that sea level rise has been caused by an amplified greenhouse effect we should be able to observe that it has been accelerating. Here’s some data on Sea levels from tide gauges around the world as reported by american NOAA on their webbsite Tides&Currents, Sea Level Trends:
Key West

Los Angeles
Aberdeen
Midway
Kiribati (a coral island nation)

Mumbai, Indien

Stockholm, where land is rising

Juneau, where land is also rising

New York, where land is sinking
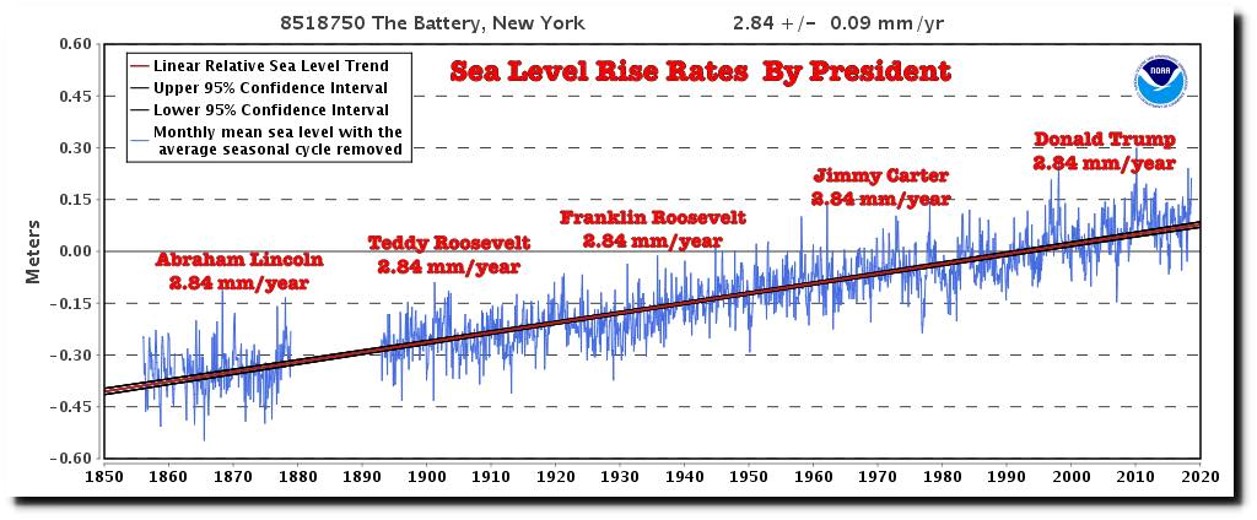 First of all – nowhere is an accelerating trend to be found in the NOAA database, which means that there is no sign of anthropogenic global warming in the tide gauge sea level data.
This is what we are supposed to accept regarding the causes of sea level rise (PSMSL, Permanent Service for Mean Sea Level):

Secondly, the fact that land is sinking i New York is not merely due to the weight of constructions, but also the corresponding effect of land rising i the north, both connected to the weight of the enormous glaciers that covered large part of the northern hemisphere in the last ice age. Land being pushed down in the north also meant land being lifted further south beyond the edge of the ice. Ever since the ice started melting the process reversed.
Thirdly, there is a fundamental misconception regarding choral islands, that they are under threat of being engulfed by rising seas. On the contrary, choral islands grow when sea levels rise. There is a reason why they are som low, right above the sea surface, namely that this is what they adapt to. (New Scientist, 2 juni 2015).
Finally, and most importantly, the official claim is that sea level rise has accelerated, but only since 1993, when satellites where first used for these measurements. However, data from the tide gauges still continues as before, with no acceleration, which is a bit suspicious:
One might assume that data from tide gauges are generally very reliable, since they also have an important practical use for shipping – to be clear, even lives are at stake. Some weather stations are also like that, for instance at airports, but in many cases the data is reported by amateurs. And while temperature data from satellites are the best we have regarding temperature, it’s not as simple to measure sea level. Therefore, one might be justified in trusting tide gauges over satellites when it comes to seal level, in case the respective data series don’t align.
On the other hand, historical tide gauge data have also, like temperature data from weather stations, been dramatically “adjusted” lately:

So, don’t be surprised if you see graphs where satellite and tide gauge data agree.
Extreme weather
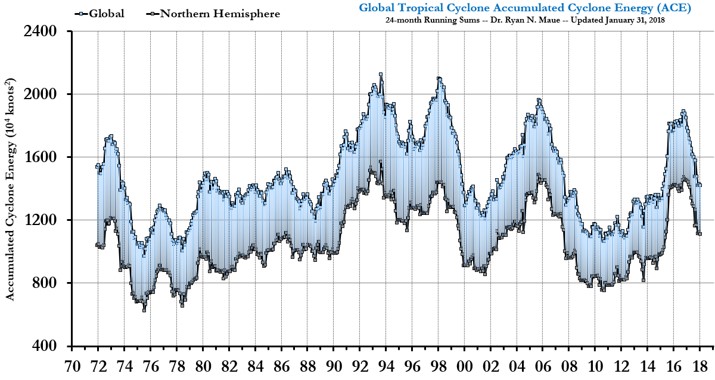
Contrary to popular belief global warming is not predicted to cause more storms, since storms are driven by temperature differences, and global warming tends to even out global temperatures, i.e. the poles warm more and faster than the equator. But even though storms are expected to decrease in numbers, they are expected to increase in intensity. Here’s the data:
Global Tropical Cyclone frequency 1970 – October 2018

Global Tropical Cyclone Accumulated Energy 1971 – January 2018
Neither has the percentage of the globe in drought increased, but instead decreased, whether in mild or exceptional forms, since 1982:
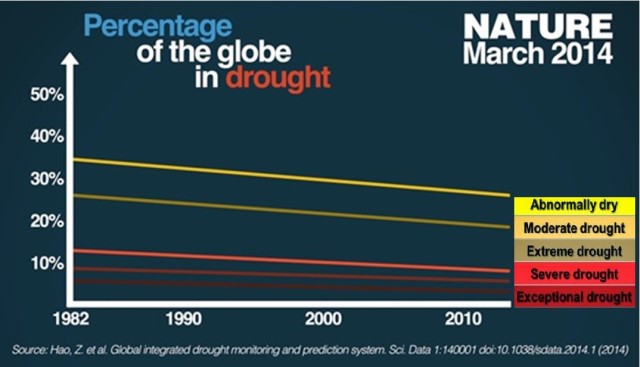
On the other hand it’s a misconception that global warming causes more drought. As a general rule warmth leads to more evaporation and precipitation and humidity. But the claim is rather that global warming makes dry regions even dryer, and wet regions wetter.
California is a typically dry region, and droughts in south-west US have become somewhat an icon for the Climate Change crisis. But this is baseless – Californa has always been dry, and much worse historically than today:
 And according to NOAA there has been no precipitation trend at all in California for over hundred years:
 The problems in California today are not at all related to global warming or greenhouse gasses, but mainly just a part of the region’s normal climate, and to some degree also the result of failed policies, some of which designed to protect wildlife by regulating exploitation of natural water reserves. The same goes for the terrible wildfires – mainly normal Californian climate, but partly also due to failed forestry policies and practices. The general trend in the USA is a decline in wildfires – which is why president Obama’s administration chose to start their graphs 1970:
 No wonder wildfires were worse in the first half of the 20th century, when the US climate was much hotter:

But this fact is obscured by the US Environmental Protection Agency (EPA) simply by starting their graph (in red) in the 1960’s, when it was cold:

Also in the world as a whole it was warmer in the first half of the 20th century than today. Record hot temperatures where more frequent in the old days (map updated 2013):
 The Sahel region south of Sahara typically has a very dry climate. Has it worsened? Here’s the data on precipitation for more than a hundred years:
 It definitely looks more like a natural climate cycle than anthropogenic global warming – notably turning less dry since the early 1980’s.
And what about the Indian subcontinent – seasonally very wet. According to the global warming hypothesis India and Pakistan should experience more extreme precipitation, but there’s no convincing sign of increasing rainfall records:

Although there’s a slight upward trend over nearly 200 years, primarily because of a few record years (around 1915, 1930 and 1960) but consistent with a mild warming trend globally, the main impression is that of a climate cycle, and the trend has been declining since 1970.
When the US Environmental Protection Agency (EPA) under president Obama prepared the IPCC meeting in Paris – the one that resulted in the Paris Accord – they presented the report National Climate Assessment (NCA) with alarming conclusions confirming the onset of climate change in the USA. Their Key Message 6:
The conclusion is based on the following data:
 There’s only one problem – why did the EPA choose to start their graph in 1958? It might be because of this:

Ocean acidification
Ocean acidification has been called the evil twin of global warming, and is perceived by many as the more dangerous and scary part of the Climate Change Syndrom, because it is supposed to threaten marine life, especially the species that use calcification to build shells. That’s not only what we call shellfish, but also species of plankton that are the basis of the food-chain in the oceans.
To begin with, “acidification” a misnomer. The oceans are not and are not turning acidic. The issue is that increasing levels of carbon dioxide may make the oceans less alkaline, but the problem is still the same, if marine life is sensitive to changes in pH.
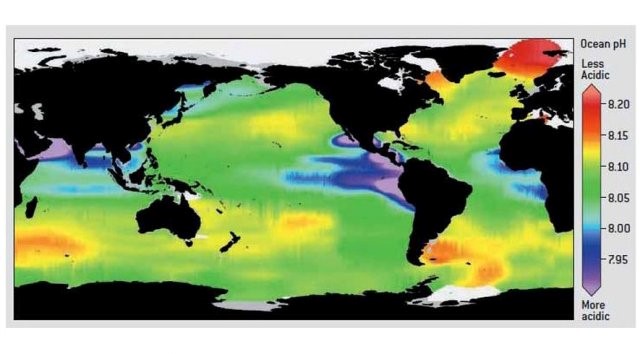
The oceans have an average pH of 8,2 (pH 7 is neutral, and below 7 is acidic) but it varies geographically as well as over time and with temperature, depth, volcanism, currents and geological conditions:
 There are even big differences at one and the same places between daytime, when carbon dioxide in the water is used for photosynthesis, and night-time, when there is no photosynthesis going on. Large changes in pH can also occur when cold water wells up from the deep, since cold water can hold more carbon dioxide than warm water can.
The ARGO system, that continually tracks changes in ocean temperature, unfortunately cannot track what happens with the pH. So the data is much more scarce. At the Aloha-station in Hawaii it is done regularly since 1990, as it happens close to the Mauna Loa station that measures atmospheric carbon dioxide (from 1957):

This looks convincing enough regarding the effect of carbon dioxide on the pH of ocean water. As atmospheric carbon dioxide increases, it increases in the seawater as well, and as expected seawater pH declines, i.e. becomes less alkaline.
So, case closed? No.
A study by Carles Pelejero et al (2005) shows how pH has changed at Flinders reef on The Great Barrier Reef since the beginning of the 1700’s. The results puts the Aloha-data into perspective:

The red line is pH (measured from Boron isotopes in corals), and atmospheric carbon dioxide is represented with blue dots (measured in Antarctic glaciers) and a blue line (measured at Mauna Loa).
Interestingly, there is no correlation between atmospheric carbon dioxide and ocean pH in these data. Ocean pH varies approximately between 7.95 and 8,15 and changes constantly over the decades, totally independent of atmospheric carbon dioxide. In comparison, the Aloha-data seem neither abnormal nor unnatural or dramatic.
But the sensitivity of marine live to pH is really the crux, and needs to be clarified in more detail in order for the issue to be resolved.
In general marine organisms, flora as well as fauna – corals, algae, plankton, shellfish and fish – seem to adapt well to increasing temperatures, levels of carbon dioxide and pH.
High levels of carbon dioxide increased growth in lobsters and crabs, according to a study from University of North Caroline, Chapel Hill:
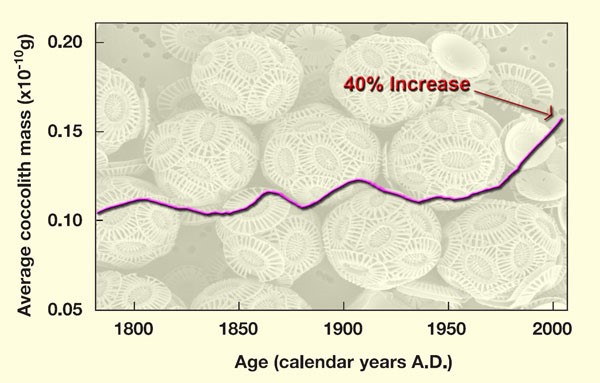
 Phytoplankton, like the Cococoliths, that are extremely important as part of the basis for the food-chain, seem to thrive both with increased temperature och level of atmospheric carbon dioxide, as shown in this graph based on data from the Atlantic Ocean:
Warmth is generally conductive to calcification, and many of the calcifying marine species can actually regulate their internal pH and produce the carbonate they need for the shells. This is not very surprising, since most of theses species have existed for very long and during times with much hinger levels of atmospheric carbon dioxide than today. In fact, as on land, plants that depend on photosynthesis benefit from higher levels of carbon dioxide – within limits, of course – since photosynthesis requires carbon dioxide.
Hoffman et al (2011) showed that pH varies naturally between 8,365 and 6,669 in a broad range of marine ekosystems – polar regions, the tropics, open sea, coastal regions, kelp forests and coral reefs. “These biome-specific pH signatures disclose current levels of exposure to both high and low dissolved CO2, often demonstrating that resident organisms are already experiencing pH regimes that are not predicted until 2100.”
In a study published in Science Advances 2015 Barkely at al reported their results from the reef at Palau Roch Islands. The reef had a naturally low pH, and because earlier laboratory experiments had shown a range of negative impacts on corals and algae the team expected the same results in the wild. Instead they found a healthy and flourishing reef with great variety of species and thriving corals.
Anne Cohen, a co-author on the study and Barkley’s advisor, commented: ‘That’s not to say the coral community is thriving because of it, rather it is thriving despite the low pH, and we need to understand how.’” (Citerat från JoNova).
It should be noted, however, that the expectations of the team were colored by laboratory experiments, where low pH was achieved by the addition of acid rather than carbon dioxide. The large Ocean Acidification database, with over 1 100 published studies, gives a less biased picture of the effects on a variety of marine organisms in 5 specified respects of exposure to a CO2-induced lowering of pH with up to 0,3 (Source: CO2Science.org):

Warming oceans
Yes, the oceans have warmed since 1880, just like the rest of Earth. But it is not as straightforward as it may sound. Since 2004 we have very good data on ocean temperatures down to 1900 meters from thousands of buoys scattered over the globe, and here’s what we’ve found out:
Some parts have been warming a little approximately the last 10 years, others av cooled, while some have had practically no change at all. On average there’s been a slight warming by 0,04°C, i.e. 0,5°C in a hundred years, provided the trend continues uninterrupted. At the equator the temperature has increased 0,06°C, corresponding to 0,75°C per century. Of course, 8 years is much too short a period to make such a prediction, but it gives some perspective. There’s doesn’t seem to be an ongoing catastrophe in the oceans, generally speaking.
The more interesting question is, however, what this warming has to do with the increase in atmospheric greenhouse gasses? As it happens – nothing.
The oceans absorb 90% of the energy that accumulates on Earth. The atmosphere only 1%. But the oceans are warmed exclusively by direct sunlight, because it is energetic enough to penetrate the water to some depth. The infrared radiation absorbed and re-emitted in all directions by greenhouse gasses is, by contrast very low in energy, and cannot warm more than the utmost layer of atoms at the ocean surface – which causes evaporation that cools the water.
Of course, the oceans can warm the air above – that’s a different story – but that heat is not from the greenhouse effect, but directly from the sun. The warming of the oceans since 1880 is the effect of an increase in Solar irradiation, and from that fact it’s easy to infer the main cause to the atmospheric warming during this period. That is not to say that greenhouse gasses had nothing at all to do with it, but it certainly implies that they are not as important to climate change as is claimed, even less it’s main cause.
Coral bleaching
Corals are not plants, but are built and inhabited by polyps, an invertebrate kind of animal, in symbiosis with an algae, that is not an animal but a kind of plant. The polyp provides the algae with carbon dioxide, phosphorus and nitrogen and gets oxygen, sugar and fat in return through the algae photosynthesis.
As it happens, coral bleaching has nothing to do with global warming. Corals are generally quite comfortable with warmer oceans. Neither is it caused by ocean acidification, as should be clear from the above remarks.
A study by Reynaud et al. (Marine Ecology Progress Series 2004) shows that coral calcification increases linearly with rising temperatures from 20 to 29°C. Similar results have been reported by Clausen and Roth (1975), Coles and Coles (1977), Kajiwara et al. (1995), Nie et al. (1997), Lough and Barnes (1997, 2000), Reynaud-Vaganay et al. (1999), Bessat and Buigues (2001), Carricart-Ganivet (2004), McNeil et al. (2004) and Reynaud et al. (2007).
The worlds corals have been around for a long time, and have survived both higher (and lower) temperatures and carbon dioxide levels. That is not to say that they haven’t been severely damaged from time to time, to eventually recover.
Coral bleaching is a natural process that occurs once in a while. It can be caused by rapid temperature changes – both warm and cold – but more importantly by intense sunlight that makes chlorophyll reactive and toxic. This is why the corals rid themselves of the algae containing chlorophyll, which in turn makes them white – but not dead, although very stressed, because they get 90% of their energy from algae photosynthesis. Normally they recover within a few years, and even though a proportion av the corals actually die, the reefs are fully restored with time. The bleaching events on the Great Barrier Reef 1998 and 2016 were caused by the effects of the weather phenomenon El Nino, that actually means calmer and more steady weather conditions, that cools the ocean surface waters, in this part of the world, but also less cloud cover and hence more sunlight. That’s also why it’s the fast-growing corals in the shallow that are mainly affected by bleaching, not the slower-growing ones on greater depth.
Dead? Dying? Or distorted truth?
Different coral species react differently to environmental disturbances, including temperature changes, diseases, variations in salinity as well as changes in sunlight, e.g. because of muddying of the water, but a main problem is of course toxins and other waste products, but also fresh water. The most severe threat to corals is probably, as in the case of the Great Barrier Reef, the over-enrichment of nutrients (eutrophication) from human waste, that also greatly promotes coral bleaching.
Read more about corals and the Great Barrier Reef at CO2Science.org.
In 2016 there was an extensive and severe coral bleaching event on the Great Barrier Reef in Australia that made alarming headlines blaming global warming. One year later they were recovering:
Great Barrier Reef starts to recover after severe coral bleaching, survey of sites between Cairns and Townsville shows
(Source: ABC NEWS, Australian Broadcasting Corporation, 29 september 2017)
Issues of judgement
Argument #6
The U.N. IPCC is a scientifically credible organisation.
One would wish, but sadly no.
The UN Intergovernmental panel on Climate Change generally enjoys great prestige and credibility. Most people imagine that it’s a congregation of thousands of the worlds most prominent experts convening and agreeing on what they conclude to be the incontrovertible scientific facts on climate change from the latest and best research.
But it is not so.
The IPCC is first and foremost a political organisation, formed, regulated and governed by politicians, diplomats and bureaucrats. It does involve thousands of scientists, but not necessarily based on merit, and in the end it’s the politicians that decide what the final report should include.
“Little known to the public is the fact that most of the scientists involved with the IPCC do not agree that global warming is occurring. It’s findings have been consistently misrepresented and/or politicized with each succeeding report.” Dr. John Christy, klimatolog vid University of Alabama i Huntsville och Alabamas statsklimatolog, huvudförfattare i FN:s tredje rapport 2001.
The journalist Donna Laframboise has shown, in her book The Delinquent Teenager who was Mistaken for the World’s Top Climate Expert, that the scientists on the panel are often not at all of the claimed quality, many of them are undergraduates, and all the literature referred to is not peer-reviewed. The lead authors are selected secretly and merely announced by the UN bureaucrats in Geneva. Many of the scientists are enrolled rather for the sake of global representation than of expertise, and activists from environmental groups have a big influence, even at the top.
Of 18 531 references in the 2007 report 5 587 were not peer-reviewed. In 21 of 44 chapters less than 60% of the references were peer-reviewed. Some of this is legitimate, like references to government reports, but in many cases it is about material produced by environmental organisations like Greenpeace and World Wildlife Fund.
Australian climate data-analyst Dr. John McLean have brought attention to the fact that very few of the scientists are actively involved in the process. Among other things he noticed the following regarding the most central IPCC position of all, namely that human activity most probably is the main cause of the warming since 1950: ”The IPCC leads us to believe that this statement is very much supported by the majority of reviewers. The reality is that there is surprisingly little explicit support for this key notion. Among the 23 independent reviewers just 4 explicitly endorsed the chapter with its hypothesis, and one other endorsed only a specific section.”
The scientists in the panel produces an extensive report covering Physics, Effects and Mitigation. But this material is then supposed to be summarized in the “Summary for Policymakers”, which is the document that is actually read by politicians and journalists. But this summary is, in reality, the result of political deliberations and negotiations, and does not always reflect the underlying science.
“There is no scientific merit to be found in the Executive Summary. The presentation sounds like something put together by Greenpeace activists and their legal department.” Dr. Andrew Lacis, climatologist at NASA and IPCC contributor.
It even happens that the summary is written months before the scientific report is finalized.
“In an extraordinary move last spring the IPCC released the 21-page SPM [Summary for Policymakers] for the Fourth Assessment Report (2007) more than three months ahead of the 1,600-page scientific report. This was to ensure that the scientific report was consistent with the SPM. In other words the science was not to conflict with the politics. […] Most of the statements of the SPM are unproven assumptions, and a review of the literature on the basis of a truly multidisciplinary approach involving physics, geology, history and archaeology leads to much different conclusions.” Dr Niel Hutton, geolog, former District Geologist for Northwest Territories and the Arctic islands in Canada.
Så här radikalt ändrades exempelvis klimatforskarnas faktiska slutsatser i den slutliga rapporten (Summary for Policymakers) från FN:s klimatpanel 1995 (citerat från John McLean, 2010):
 There are many, many more reputable scientists that have been involved in the IPCC, and many others too, that are critical. I have collected a considerable number of them:
So no, the IPCC is not scientifically credible.
Argument #7
Computer models reliably predict future climate.
Yes and no. Some say that since meteorologist can’t predict the weather, less than perfectly, more than a couple of weeks ahead, it’s absurd to expect them to make predictions tens or hundreds of years in the future. But this is based on a misunderstanding. Predicting climate is something very different from predicting weather. Climate prediction is basically a statistical discipline, grounded in an analysis of weather patterns over decades. Climate models can’t predict weather at the same level of detail as the Weather Channel, but may, given appropriate input, be expected to predict low-resolution general trends for very long periods.
There are two major problems with climate models, however:
The first is precisely that of “appropriate input”. Our understanding of the details of climate and the drivers of climate change is incomplete. We don’t fully understand cloud formation, for instance, or the effects of aerosols. When climate models are calibrated some of these factors are adjusted to fit historical records, but since our knowledge is incomplete the margin of error is big, and there’s a risk they are used as “fudge factors”. More importantly the physical laws programmed into the depends on a proper understanding of the processes involved in climate change, most notably the sensitivity of the climate to changes in atmospheric levels of greenhouse gasses.
The second has to do with the margins of error, because they accumulate over the years. In fifty or a hundred years from now they have grown so big that they really don’t mean anything, and we will never know whether the predictions were correct or not.
Climate models are a useful tool to test hypotheses and experiment with the climate, but they are very over-rated, as if they were some kind of crystal ball. It all depends on our understanding of the climate system, which i still incomplete and controversial. So far the climate models have failed miserably when compared to observations, at least data from satellites and weather balloons:
Argument #8
No-one profits from promoting anthropogenic global warming.
Not true. But how?
Wouldn’t anyone who could prove that the threat of climate catastrophe doesn’t exist be considered a hero and immediately receive the Nobel Prize? Wouldn’t all the world be incredibly relieved?
I don’t think so. In reality sceptics are silenced, shunned and harassed, as though they were “heretics” or evil. Why is that? Who benefits from promoting the idea of the imminent end of the world due to the “sins” of humanity? Well, it rings a bell, doesn’t it? It’s an old theme, used through history for power, revenue and control – and always effective despite never really happening. Today it’s not the priests and the church preaching, but other professionals and institutions.
Scientists
First, it’s an unfortunate fact that scientific research has become more and more dependent on state funding, i.e. politicians. In order to receive research funding scientists and institutions it helps to induce a sense of urgency, so the scientific enterprise is perceived as beneficial to society. Today, hundreds of thousands of scientists are dependent on the existence of dangerous global warming for funding. It’s apparently wise to make at least some reference to global warming, however far-fetched, when applying for funding. The cartoon below is, regrettably, quite true: Unsurprisingly, many public sceptics are retired and no longer dependent on state funding. A young person would risk both funding, career and reputation in daring to air a critical view.
I don’t think most scientists make conscious choices about the position they take on climate change. The pressure from the group and the material motivations do their work in a subtle and to a large extent emotional level. If you’re on a gravy train you don’t tend to reflect too much on choices that may throw you off.
Groupthink is an old and well known phenomenon and more of a fact of life than a far-fetched conspiracy theory.
It’s not all about money – it’s also about prestige and life-time achievements. Artikeln NN citerar en anonym forskare: What if climate change appears to be just mainly a multi-decadal natural fluctuation? They’ll kill us probably…”
Politicians
Dangerous Anthropogenic Global Warming is an almost perfect political agenda to energize voters, gain points for caring about the Planet and future generations and motivate the people to give up more power and tax money to the state. Since global warming problem with a long time-horizon symbolic policies without accountability pay off greatly.
Media
Media is also an obvious winner on the global warming gravy-train. Their appetite for startling headlines is satisfied more or less on a daily basis, and global warming may certainly be one of the most profitable issues in modern times. The worse the catastrophe, the better, and the climate news often exaggerate and rarely scrutinize. “Don’t ruin a good story by fact checking it”, seems to be their motto.
Environmental organisations
Organisations like Greenpeace and World Wildlife fund may have an idealistic core, but there is no denying that today they are also multinational corporations employing thousands and depending heavily on motivating members and supporters with emotional images, scary stories and grim predictions.
Big Business
There are many ways corporations can benefit from climate policies, let it suffice to mention emissions trading.
“Green” companies and products
All companies today are eager to project environmental care onto their trademarks. being “green” to save the planet has become a selling point. But some companies, especially those in the “renewable energy”-industry have, of course, benefited enormously from subsidies.
Ideological special interests
Especially within the ideological left man-made global warming is regarded as a lever to promote a political agenda, for instance to redistribute the wealth in the world, even primarily and regardless of the scientific evidence.
Ottmar Edenhofer was co-chair of the IPCC’s Working Group III, and was a lead author of the IPCC’s Fourth Assessment Report released in 2007: “But one must say clearly that we redistribute de facto the world’s wealth by climate policy. […] One has to free oneself from the illusion that international climate policy is environmental policy. This has almost nothing to do with environmental policy anymore, with problems such as deforestation or the ozone hole.”
A remark from Maurice Strong, who organized the first U.N. Earth Climate Summit (1992) in Rio de Janeiro, Brazil: “We may get to the point where the only way of saving the world will be for industrialized civilization to collapse.”
Former U.S. Senator Timothy Wirth (D-CO), then representing the Clinton-Gore administration as U.S undersecretary of state for global issues, addressing the same Rio Climate Summit audience: “We have got to ride the global warming issue. Even if the theory of global warming is wrong, we will be doing the right thing in terms of economic policy and environmental policy.”
Also speaking at the Rio conference, Deputy Assistant of State Richard Benedick, who then headed the policy divisions of the U.S. State Department: “A global warming treaty [Kyoto] must be implemented even if there is no scientific evidence to back the [enhanced] greenhouse effect.”
In 1988, former Canadian Minister of the Environment, told editors and reporters of the Calgary Herald: “No matter if the science of global warming is all phony…climate change [provides] the greatest opportunity to bring about justice and equality in the world.”
(Source: Forbes).
Anti-democratic interests
Global warming is also a useful issue for those who wish to centralize political power to supranational institutions, i.e. a world government. To some big companies and banks this is an attractive scenario because a united world without borders and nations would facilitate business, but also, and perhaps more importantly, provide a single gateway to power and control. The Club of Rome, the creation of Standard Oil-founder David Rockefeller, was quite explicit about this in their 1991 publication “The First Global revolution”:

In 1996, former Soviet Union President Mikhail Gorbachev emphasized the importance of using climate alarmism to advance socialist Marxist objectives: “The threat of environmental crisis will be the international disaster key to unlock the New World Order.”
Speaking at the 2000 U.N. Conference on Climate Change in the Hague, former President Jacques Chirac of France explained why the IPCC’s climate initiative supported a key Western European Kyoto Protocol objective: “For the first time, humanity is instituting a genuine instrument of global governance, one that should find a place within the World Environmental Organization which France and the European Union would like to see established.”
What about Big Oil?
Well, when it comes to scientific evidence, the financing doesn’t really matter. In the first part of this test, focussing on the scientific issues, it doesn’t matter whether I am being payed by Big Oil or not. Either I am right, or I am not. But in order to explain and understand scientific fakery and fraud it is necessary to trace the money. As it happens, it is a myth that the big money in the climate debate comes from Big Oil. In 2009 the U.S Government spent over 6,5 billion dollars on climate change – of which over 2 billion dollars went to climate research – while organizations promoting skepticism received just 64 million dollars annually between 2003 and 2010 – of which not all was spent just on the climate issue, since many of these organizations have a range of other purposes too:

Argument #9
Mitigation of climate change is all positive regardless of whether it is Man-made or not.

No doubt, a crisis like global warming – imagined or not – may result in the creation of good things. But on balance it’s absurd to claim that it is rational to waste hundreds of billions of dollars on a non-existing problem when there are som many real problems in the world that we could actually solve, and should focus on instead – diseases, starvation, poverty, lack of education, bad infrastructure, inequality, oppression and – not the least – a whole range of environmental problems.
When the Björn Lomborg, the founder and president of the Copenhagen Consensus Center, asked prominent economists to prioritize the most important problems in the world, global warming was not even on the list.
Part of the consideration is, that even according to the IPCC, the costs of measures to mitigate global warming are gigantic while the effects are miniscule:

As mentioned in the comment in the graph, the effects of the global warming crisis also have immeasurable psychological effects that it is impossible to know in what way they will affect the productivity and lives of people. What amount of possible positive effects of non-existing global warming are worth millions of children growing up worrying about the future and in many cases losing hope?
Then we have to consider the political consequences – mitigating global warming requires international agreements and, according to some, even a “temporary” dictatorship by a world government, to ensure compliance.
Further, I don’t think it’s a good idea to politicize technological development. That’s not the way the best ideas win.
Sky-rocketing carbon taxes, “cap’n’trade”, misguided subsidies and general waste of money will make us all poorer, which probably in the end will be detrimental for the environment from all aspects. Environmental care increases as societies grow wealthier, so that’s probably what we should focus on instead. Wealthier societies also grow more resilient to all kinds of disasters, including climate change, natural or not.
It’s true that some investments in renewable energy and “green” technology will stimulate economic growth, but if anthropogenic global warming is non-existent, most of it will be a waste and of now use.
Argument #10
Better to be be safe than sorry – taking climate change seriously is like an insurance in case it really is Man-made.
Well, not really.
As shown above it’s more like purchasing a really expensive house insurance that pays out just a fraction of its worth if it burns down.
The cost of an insurance in terms of the Paris agreement is mentioned above, but it covers only 2% of what it would take to achieve the (somewhat artificial and politically negotiated) UN goal of avoiding a 2°C warming. The real cost, then, would be about 50 times more than the cost for the Paris agreement alone – 5 000 trillion dollars.
To be clear, there are many attempts to calculate the cost of “doing nothing” – having no insurance – but it’s fair to say none of them are trustworthy. They are just estimates. But “doing nothing” isn’t really that, but rather “not implementing specially designed climate mitigation policies, such as subsidies to ‘green technologies’, sky rocketing carbon taxes and other measures to impede the use of fossil fuels”. It means letting the free market take care of the problem through growth that creates wealth and climate security, and innovation that creates ever more efficient and cleaner technologies and energy resources. The use of fossil fuels will be extremely beneficial, until we invent other forms of equally cheap, plentiful and reliable forms of energy. In my estimation, then, “doing nothing” will also cost nothing, but rather be very positive economically.
On the other hand, doing “something” will, in my estimation, probably impede growth and increase poverty – and all the problems that goes along with that, not the least a larger vulnerability to natural disasters and climate change.
If we ought to prepare for the risk of catastrophic global warming, we certainly should get an insurance for global cooling as well. Not only because there’s a considerable chance that the world will enter into a new Little Ice Age according to the Solar Cycles, but also because we are just one big volcanic eruption away from decades of a dark, global and bitter cold all-year-round winter. If that happens, fossil fuels would be helpful while solar panels and windmills (and even hydroelectrical power) would be useless.
Argument #11
It’s a good thing that we end our addiction to fossil fuels anyway.
I think it’s fitting to end this essay by commenting on carbon dioxide, this essential substance that plays the central role in most of the arguments above.
Carbon dioxide has been framed as a villain, and some countries are including it as a pollutant in their legislation. Of course because of it’s alleged role in the hypothesis of dangerous anthropogenic climate change. I hope I have thoroughly refuted that idea, but even regardless we need to remind ourselves of the whole truth about this substance and all it’s benefits.
Generally speaking carbon dioxide is not at all a pollutant, but a vital gas for all life forms. It takes several times the levels of today to make this gas detrimental to human health. It is an invisible and odourless gas, although global warming propaganda loves to portray it as dirty:

What we actually see is not “carbon”, but a plume of water vapor from the shadow side. Fifty years ago coal power plants emitted a lot of soot, but that’s history, at least in modern plants.
All life is carbon based, and one of natures greatest wonders is that plants need carbon dioxide to live, and turn it into the waste product oxygen, that animals need to live – and turn it into the waste product carbon dioxide.
We actually exhale 100 times (40 000 ppm) more carbon dioxide than we inhale (400 ppm). As we can save a person through mouth-to-mouth resuscitation 40 000 ppm carbon dioxide cannot really be that dangerous even at levels that would be extremely high were it in the atmosphere. Of course, it is still just 4% of the air we exhale.
The preindustrial climate is often represented as “natural” and “ideal”, but nothing could be further from the truth. The industrial revolution was preceded by 500 years of bitterly cold climate, with bad harvest, social unrest, decease and war. The Swedish chemist Svante Arrhenius, one of the early scientists calling attention to the greenhouse effect, was enthusiastic for the prospect of a warmer climate, and during the Global Cooling scare in the 1960’s and 70’s the horror was a possible return of a Little Ice Age like the one in preindustrial times. Neither was the level of atmospheric carbon dioxide in any way ideal, but rather close to the limit at which plants start to die.
Life has flourished on Earth in times with several times higher levels of atmospheric carbon dioxide than today. In fact, carbon dioxide is used by commercial greenhouse farmers to increase growth:
 Plants also grow more resilient in an environment rich in carbon dioxide. This is because they need fewer pores in the leaves to take up the carbon dioxide they need, and thereby also loose less water through evaporation. In that way they can survive more arid environments than otherwise.
According to Boston university most of the Earth has become significantly greener of rising levels of atmospheric carbon dioxide between 1982 and 2015: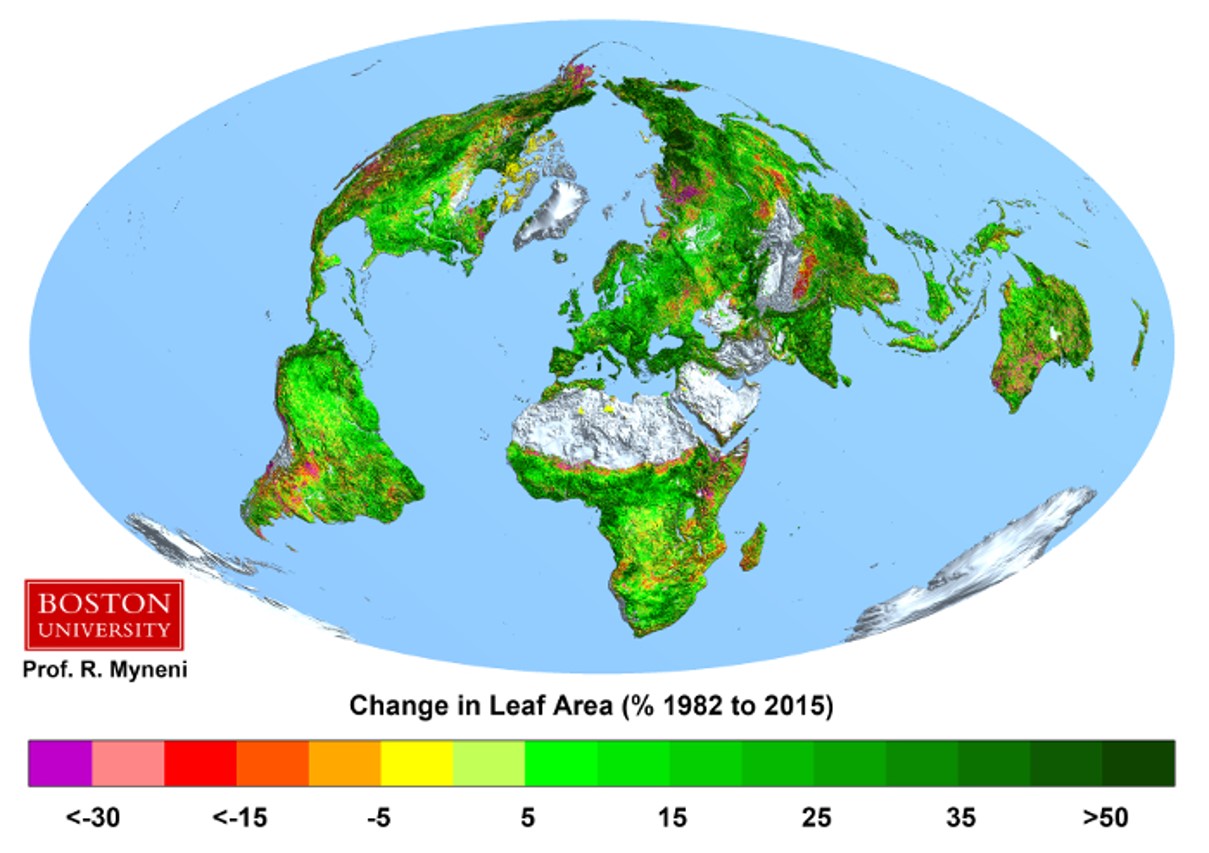
The Planet seems to be thriving thanks to human emissions! Crop yields have also increased quite remarkably (partly because of fossil fuels used for machines and fertilisers:
Anyone worrying about feeding a growing world population should be grateful for rising atmospheric carbon dioxide levels.
In a wider perspective neither the fossil fuels themselves ar just pollutants. Apart from carbon dioxide the waste from fossil fuels is nowadays largely purified from toxic substances, but even though an energy form has downsides they must always be weighed against the advantages. The world needs cheap, plentiful and reliable energi and fossil fuels contributes to raising the standard and quality of life that allows us to live longer and more healthy lives. The more fossil fuels are used, the wealthier, healthier and safer the world becomes:

And even though the decrease in infant mortality rates and increase in life expectancy have contributed to population growth, increasing wealth actually has contributed to a decrease in birth rates and population growth rate.
Cheap, plentiful and reliable energy has provided us with economic growth and resources for schools, hospitals, infrastructure and machines to do the heavy lifting in all industries, including agriculture, more efficiently. Fossil fuels have meant better housing, light at night, refrigeration, indoor climate control and washing machines. They have also made us safer against climate catastrophes, man-made or not! It’s not true that nature gives us a safe environment that we make dangerous. Rather, nature gives us a dangerous environment that we make safer thanks to cheap, plentiful and reliable energy.
Poor countries are worse affected by extreme weather. Storms that in extreme cases cause a handful of casualties on the US east coast might cause hundreds or thousands of deaths in Haiti. Poor countries also care less about the environment – survival comes first, naturally:

Maybe the wise thing is not to invest billions to fight fossil fuels, but rather to use these resources to fight poverty, decease, starvation and to promote growth, education, infrastructure, construction, emergency services – all the things that not only makes societies flourish, but also makes them more resilient to climate disasters.
And the threat of “peak oil” we have heard about since the 1960’s is actually far away: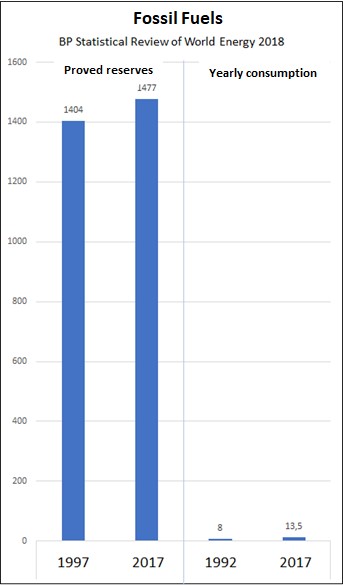
The reserves have increased by, on average, 3,6 billion tons (oil equivalents) per year – consumption only 0,22.
“Natural resources” are not a fixed quantity, but the result of human ingenuity. In fact, the most important natural resource is human creativity.
It is quite clear that so called “renewable energy” is not going to replace fossil fuels soon, because they are expensive, unreliable and impossible to store in a convenient way. Besides, they have their own environmental downsides too, apparent from this areal photo of a rare earth metal-mine:

